North Tyneside Council Tax
(In association with the Local Public Message Board)
20010/11 Update
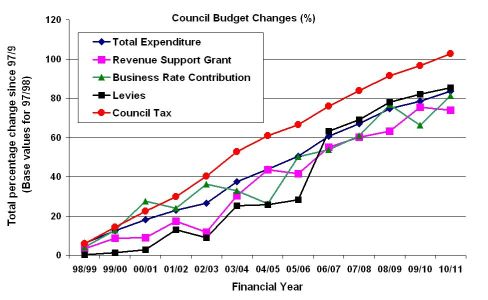
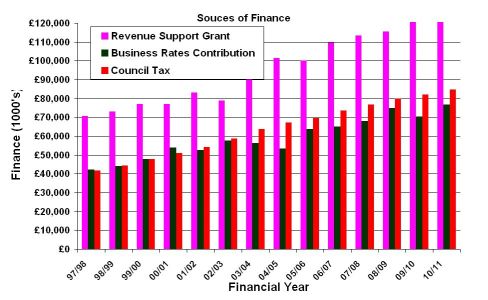
As usual, the graph plots above have been drawn up from the Council Tax booklets supplied by NTMBC over the last 14 years. Larger sized copies may be viewed by clicking on them.
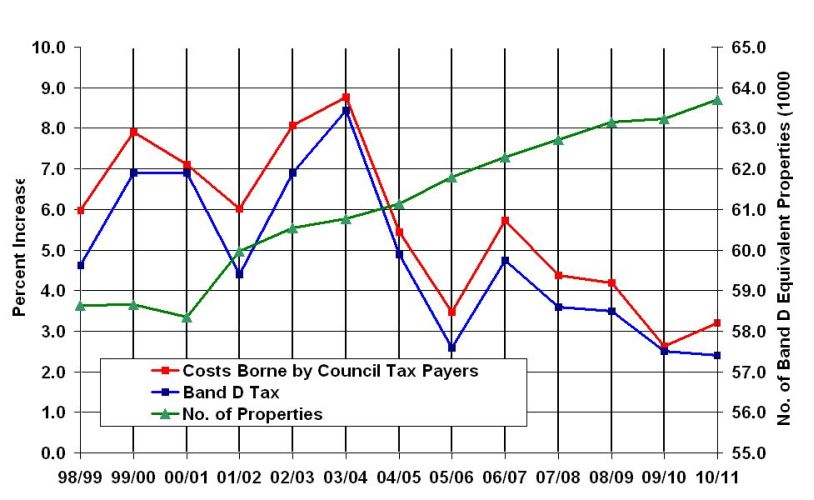
Please note that the "Council Tax" figure used in all the graphs comes from the simple budget statement in the booklet that comes with the demand for the coming year, where it is referred to as "Cost Borne by Council Tax Payers". The rise in this figure since last year is 3.21%. The rise in the "Cost Borne by Council Tax Payers" figure since 1997/8 is 102.8%. The rise in actual Council Tax per household this year is 2.4%. Part of the reason for the difference in the two figures, 3.21% and 2.4%, lies in the increase in the number of households that pay Council Tax. The figure below shows the year on year percentage increase in "Cost Borne by Council Tax Payers" and for the Band D tax. (As the latter is expressed as a percentage the value is the same for all Council Tax bands.) The third graph in green is the number of equivalent Band D properties in North Tyneside used by the Council to determine the Council Tax. Figures for the last 10 tax years, including this year have been supplied by the Council - those for the earlier years are estimates.
This year, for the fifth year running, the Revenue Support Grant has been split into two parts in Council statements, one called Revenue Support Grant, and the other called Dedicated School Grant. For the graphs I have kept them lumped together and continue to call the result, "Revenue Support Grant".
R Smith 31 March 2010


