North Tyneside Council Tax
(In association with the Local Public Message Board)
The earlier page last updated on 2 May 2011 is still available here.
20012/13 Update
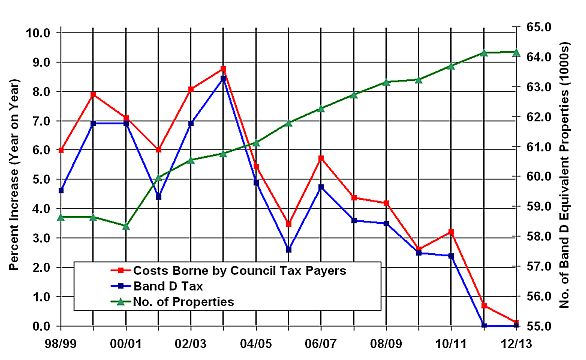
As usual, the graph plots below have been drawn up from the Council Tax booklets supplied by NTMBC over the last 16 years.
The graph above shows the % rise from one year to the next for the total council tax (Costs Borne by Council Tax Payers) and the Band D council tax, for the tax years 98/99 to 12/13. The difference is linked to the increase in the number of properties subject to council tax, but not wholly explained by this.
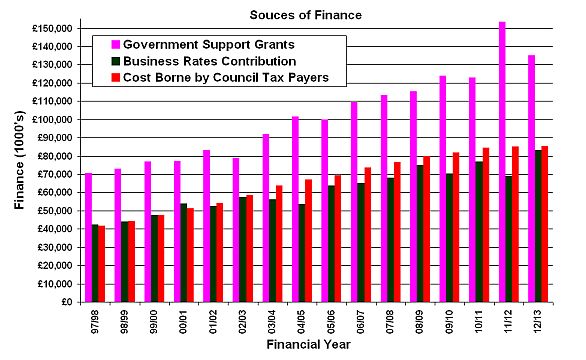
The Revenue Support Grant and the Dedicated Schools Grant have been added together, as in earlier years, and I have called it "Government Support Grants". This year there has been a slight increase in the Dedicated Schools Grant (from £132 m to £133.4 m) and large drop in the Revenue Support Grant (from £21.4 m to £1.6 m).
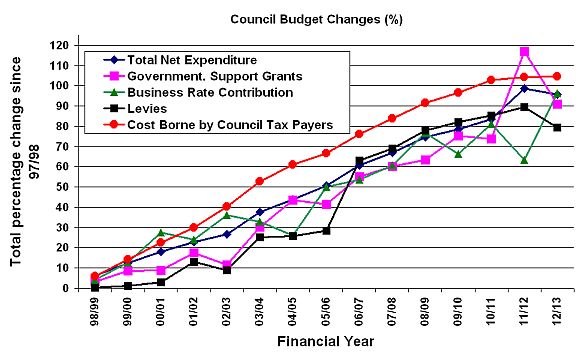
The Total Net Expenditure in the graph below includes the Dedicated Schools Grant. (It is the Total General Fund Net Expenditure + the Dedicated Schools Grant!)
The graph above shows the total % rise for a variety of components of the council's total (revenue account) expenditure since 1997/8. The total % rise in Band D council tax (not shown) since 1997/8 is 83.5 percent. (This can be compared to the RPI increase since 1997 of some 54 %.)
R Smith 2 May 2012
If you wish to comment on this webpage please contact Robin Smith by email.